MBA 621 Financial Analysis Project
Andy Gruenbaum
Fall 1997
Questions 1 and 2 – See Exhibit A
Liquidity
- NPI’s current ratio is slightly below average making it less liquid than the rest of the industry.
- NPI has an above average quick ratio compared to the industry average. However, even with this better than average quick ratio, NPI would need to sell inventory to pay off short-term obligations.
Asset Management
- NPI does very well in its asset management ratios.
- On all of these ratios, NPI does slightly better or much better than the industry.
- NPI’s excellent job of managing the company’s assets helps it overcome some of NPI’s weaknesses including its high debt.
Debt Management
- NPI is a highly leveraged company which would make it very difficult for NPI to obtain additional financing.
- In the most recent year, NPI’s times-interested-earned ratio for 1996 reveals NPI is generating only $5.84 in operating income for every dollar of interest expense. With the industry average being $20.15, NPI is at much more vulnerable than its competition to changes in the market place including higher interest rates.
Profitability
- After the restructuring charge of 1995, NPI is bringing the company back into a more acceptable range of profitablity.
- The profit margin and ROA have rebounded very nicely in the most recent year. If NPI continues rebounding these ratios and if it can maintain its present ROE, NPI will continue to be a profitable company.
Question 3 – See Exhibit E
- NPI has shifted more of its assets to non-liquid. This is not necessarily negative. It simply means that if NPI needs to cover expenses, it is going to have a more difficult time doing so.
- The receivables have decreased which explains why the Days Sales Outstanding ratio is much lower than the industry. Two possible causes for this could are NPI’s collection of receivables has improved from 1994 or many of NPI’s customers are paying with cash.
- Inventory has decreased which is likely due to management’s more effective job of stocking the proper inventories.
- The combination of the long-term debt and liabilities equals nearly 50% of NPI’s total liabilities and shareholders equity. This confirms that NPI is highly leveraged.
Question 4 – See Exhibits B and C
- Both SG&A and Cost of Sales remain very constant at a combined total of approximately 80 to 85%.
- The restructuring charge of 1995 caused shifts from net income available for common shareholders to provisions for restructured operations.
Question 5 – See Exhibits F and I
- NPI profitability is about one-half of American Home Products (AHP). NPI is not controlling its expenses quite as well which is probably due to NPI’s continued absorption of the restructuring charges from the previous year.
- NPI turns its inventory almost twice as fast as AHP. Thus, NPI’s total asset turnover ratio is significantly better.
- NPI’s higher equity multiplier ratio shows NPI is using debt much better than AHP. NPI’s increased use of financial leverage enables NPI to compete much better within their industry. However, it also opens them up to more risk.
- NPI has a higher ROE than AHP making it more attractive to investors.
Question 6
- NPI’s health is improving evidenced by its increase of more than 20% of cash and cash equivalents at the end of 1996 over the previous year.
- Furthermore, its restructuring from 1995 is proving to be successful in increasing net cash from operating activities.
- Nonetheless, investors may be cautious due to NPI’s large capital expenditures over the last several years. However, NPI may be in an industry that is very dependent on continuing to invest in plant and equipment.
- Over the next few years, NPI’s continued improving health is dependent on its ability to continue to effectively manage its debt.
Question 7 – See Exhibits D, G and H
- To make it through the end of 1997, NPI will need to raise $298,454,000 of additional funds.
- Very plausible. NPI has increased its profit margin and other profitability ratios in 1996. If it continues this trend, NPI should be able to attain its projected forecast. However, due to its high debt, NPI will need to raise its AFN by methods other than traditional borrowing. NPI might issue additional common stock or bonds. Additionally, NPI could reissue some of its treasury stock. Although many variables could affect the forecast, rising interest rates or failure to gain additional market share will negatively impact NPI’s ability to compete in the home product industry.
EXHIBITS
EXHIBIT A
| Category | Financial Ratios | 1996 | 1995 | Industry Averages | |
| Liquidity | |||||
|
Current |
1.25 |
1.35 |
1.42 |
||
|
Quick |
0.84 |
0.90 |
0.77 |
||
| Asset Management | |||||
|
Total Asset Turnover |
1.11 |
1.09 |
1.04 |
||
|
Days Sales Outstanding |
43.80 |
48.11 |
57.00 |
||
|
Inventory Turnover |
11.35 |
10.79 |
3.61 |
||
| Debt Management | |||||
|
Debt |
74.26% |
78.02% |
62.96% |
||
|
Times Interest Earned |
5.84 |
2.77 |
20.15 |
||
| Profitability | |||||
|
Profit Margin On Sales |
7.05% |
1.80% |
11.97% |
||
|
Return On Total Assets |
7.80% |
1.97% |
12.48% |
||
| Return On Common Equity |
37.57% |
11.78% |
31.53% |
||
EXHIBIT B
| National Products, Inc.: Common Size Income Statements | |||
|
1996 |
1995 |
1994 |
|
| Net sales |
100.00% |
100.00% |
100.00% |
| Cost of sales |
50.88% |
52.08% |
51.57% |
| Gross Profit |
49.12% |
47.92% |
48.43% |
| SG&A |
34.89% |
34.45% |
34.60% |
| Provision for restructured operations |
0.00% |
5.51% |
0.00% |
| Interest expense |
2.26% |
2.46% |
1.14% |
| Other expenses |
1.07% |
1.15% |
1.09% |
| Earnings before taxes |
10.91% |
4.35% |
11.60% |
| Provision for income tax |
3.65% |
2.29% |
3.95% |
|
Net income before preferred dividends |
7.26% |
2.06% |
7.65% |
| Preferred stock dividends |
0.24% |
0.26% |
0.28% |
|
Net income available for common shareholders |
7.01% |
1.80% |
7.36% |
EXHIBIT C
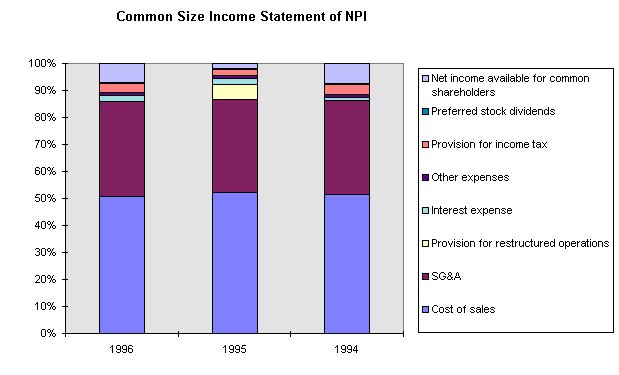
EXHIBIT D

EXHIBIT E
| National Products, Inc.: Common Size Balance Sheets | ||||
|
1996 |
1995 |
1994 |
||
| ASSETS | ||||
| Current assets: | ||||
| Cash and cash equivalents |
3.14% |
2.73% |
2.77% |
|
| Marketable Securities |
0.75% |
0.63% |
0.77% |
|
| Recievable (net of allowances) |
13.47% |
14.61% |
17.09% |
|
| Inventories |
9.75% |
10.14% |
11.62% |
|
| Other current assets |
2.90% |
2.77% |
3.20% |
|
|
Total current assets |
30.02% |
30.88% |
35.45% |
|
| Property, plant and equipment (net of depreciation) |
30.74% |
28.20% |
32.37% |
|
| Goodwill and other intangibles (net of amortization) |
34.43% |
35.88% |
27.22% |
|
| Other assets |
4.81% |
5.04% |
4.96% |
|
|
Total assets |
100.00% |
100.00% |
100.00% |
|
| LIABILITIES AND SHAREHOLDERS EQUITY | ||||
| Curent liabilities: | ||||
| Notes and loans payable |
2.18% |
2.67% |
2.96% |
|
| Accounts Payable |
9.51% |
9.67% |
11.31% |
|
| Current portion of long-term debt |
1.40% |
0.48% |
0.42% |
|
| Accrued income taxes |
1.18% |
1.00% |
1.39% |
|
| Other accrued expenses |
9.83% |
9.11% |
8.81% |
|
| Total current liabilities |
24.10% |
22.94% |
24.90% |
|
| Long-term debt |
35.27% |
39.15% |
28.51% |
|
| Deferred income taxes |
2.97% |
3.11% |
4.81% |
|
| Other liabilities |
11.92% |
12.82% |
12.10% |
|
| Total liabilities |
74.26% |
78.02% |
70.32% |
|
| Shareholders equity: | ||||
| Preferred stock |
4.97% |
5.28% |
6.65% |
|
| Common stock ($1 par value) |
2.32% |
2.40% |
2.98% |
|
| Additional paid-in capital |
13.94% |
13.53% |
16.61% |
|
| Retained earnings |
34.56% |
31.30% |
40.65% |
|
| Cumulative translation adjustments |
-6.77% |
-6.71% |
-7.11% |
|
| Unearned compensation |
-4.69% |
-4.95% |
-6.29% |
|
| Treasury stock (at cost) |
-18.59% |
-18.87% |
-23.81% |
|
| Total shareholders equity |
25.74% |
21.98% |
29.68% |
|
|
Total liabilities and shareholders equity |
100.00% |
100.00% |
100.00% |
|
EXHIBIT F
| Profit Margin |
Total Assets Turnover |
Equity Multiplier |
ROE |
||
| NPI |
7.26% |
1.11 |
3.88 |
31.22% |
|
| American Home |
13.37% |
0.68 |
2.99 |
27.05% |
|
EXHIBIT G
NPI: ACTUAL 1996 AND PROJECTED 1997 INCOME STATEMENTS
(MILLIONS OF DOLLARS)
|
Actual 1996 |
Forecast Basis |
First Pass |
|
| Net sales |
$8,749,000 |
x 1.05 |
$9,186,450 |
| Cost of sales |
$4,451,100 |
x 1.05 |
$4,673,655 |
|
Gross Profit |
$4,297,900 |
$4,512,795 |
|
| SG&A expense |
$3,052,100 |
x 1.05 |
$3,204,705 |
| Provision for restructured operations |
$0 |
$0 |
|
| Other expenses |
$93,800 |
x 1.05 |
$98,490 |
|
Earnings before interest and taxes |
$1,209,600 |
||
| Interest expense |
$197,400 |
$197,400 |
|
| Earnings before taxes |
$954,600 |
$1,012,200 |
|
| Provision for income taxes(40%) |
$319,600 |
$404,880 |
|
|
Net income before preferred dividends |
$635,000 |
$607,320 |
|
| Preferred stock dividends |
$21,400 |
$21,400 |
|
| Net income available for common shareholder |
$613,600 |
$585,920 |
|
| Dividends to common(8% increase in dividends) |
$571,740 |
$617,479 |
|
|
Addition to retained earnings |
$41,860 |
-$31,559 |
EXHIBIT H
NPI: ACTUAL 1996 AND PROJECTED 1997 BALANCE SHEETS
(MILLIONS OF DOLLARS)
|
Actual 1996 |
Forecast Basis |
First Pass |
|
| Cash and cash equivalents |
248,200 |
x 1.05 |
260,610 |
| Marketable Securities |
59,600 |
x 1.05 |
62,580 |
| Accounts receivable |
1,064,400 |
x 1.05 |
1,117,620 |
| Inventories |
770,700 |
x 1.05 |
809,235 |
| Other current assets |
229,400 |
x 1.05 |
240,870 |
|
Total current assets |
2,372,300 |
2,490,915 |
|
| Property, plant, and equipment |
2,428,900 |
x 1.05 |
2,550,345 |
| Goodwill and other intangibles |
2,720,400 |
x 1.05 |
2,856,420 |
| Other assets |
379,900 |
x 1.05 |
398,895 |
|
Total assets |
7,901,500 |
8,296,575 |
|
| Notes and loans payable |
172,300 |
172,300 |
|
| Accounts Payable |
751,700 |
x 1.05 |
789,285 |
| Current portion of long-term debt |
110,400 |
110,400 |
|
| Accrued income taxes |
93,100 |
x 1.05 |
97,755 |
| Other accrued expenses |
776,800 |
x 1.05 |
815,640 |
|
Total Current Liabilities |
1,904,300 |
1,985,380 |
|
| Long-term debt |
2,786,800 |
2,786,800 |
|
| Deferred income taxes |
234,300 |
234,300 |
|
| Other liabilities |
942,000 |
x 1.05 |
989,100 |
| Shareholders equity: | |||
| Preferred stock |
392,700 |
392,700 |
|
| Common stock ($1 par value) |
183,200 |
183,200 |
|
| Additional paid-in capital |
1,101,600 |
1,101,600 |
|
| Retained earnings |
2,731,000 |
-$31,559 |
2,699,441 |
| Cumulative translation adjustments |
-534,700 |
-534,700 |
|
| Unearned compensation |
-370,900 |
-370,900 |
|
| Treasury stock (at cost) |
-1,468,800 |
-1,468,800 |
|
| Total shareholders equity |
2,034,100 |
2,002,541 |
|
|
Total liabilities and shareholders equity |
7,901,500 |
7,998,121 |
